CLI Tools & Terminal
Calmo Bridge IDE includes an integrated terminal that allows you to execute CLI commands on your local machine directly from Calmo conversations. The terminal provides real-time output streaming, full shell integration, and a seamless approval workflow—all without leaving the Bridge interface.Overview
When connected via Calmo Bridge IDE, Calmo has access to powerful command execution capabilities:Integrated Terminal
Full terminal emulation with shell prompt, colors, and real-time output streaming
Command Approval
Review commands in a dedicated approval panel before they execute
Process Management
Start, monitor, and terminate long-running processes
Activity History
Track all executed commands with status indicators and full output
How It Works
The command execution flow integrates seamlessly with your chat workflow:1
Chat with Calmo
Ask Calmo to run a command in the chat panel (right sidebar):“Hey, can you check what pods are running in the staging namespace?”
2
Review Command
The command appears in the Command Approval panel at the top right: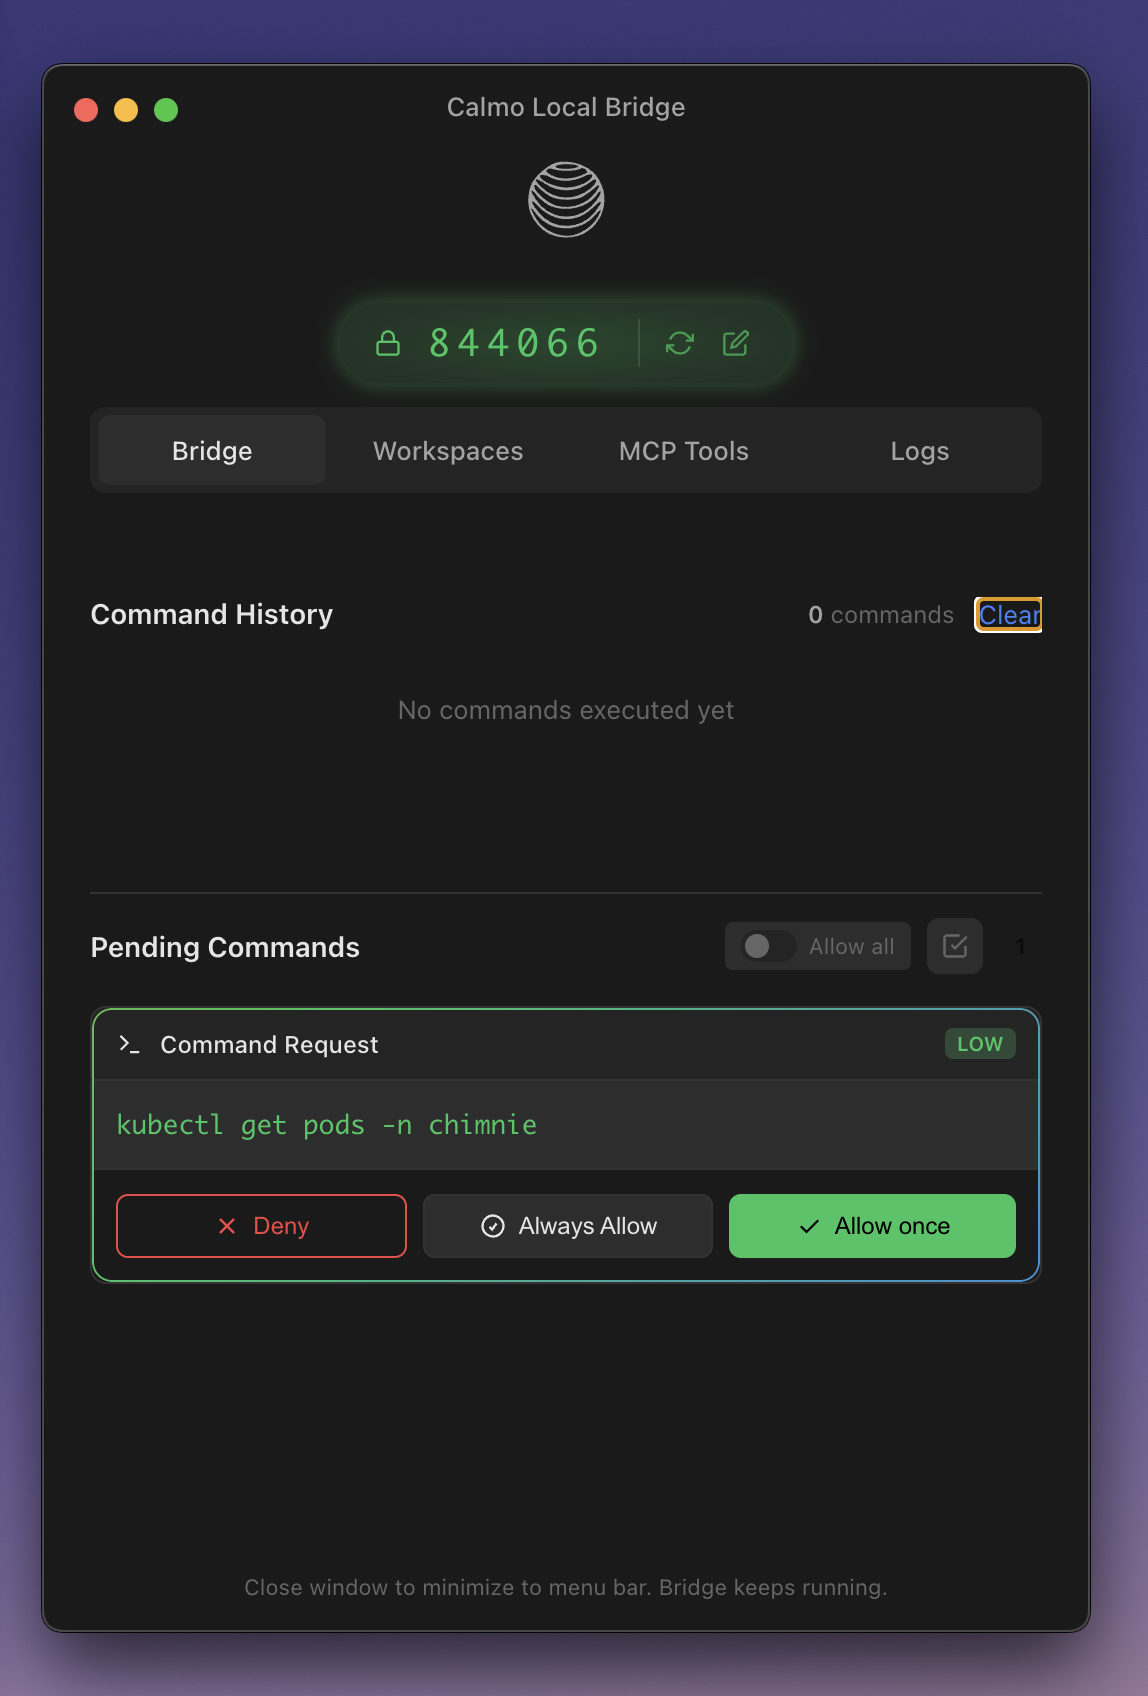
3
Approve or Deny
Choose your action:
- Deny - Reject the command
- Always - Auto-approve this pattern in the future
- Allow - Execute just this once
4
Watch Execution
Output streams in real-time to the Terminal panel (bottom center):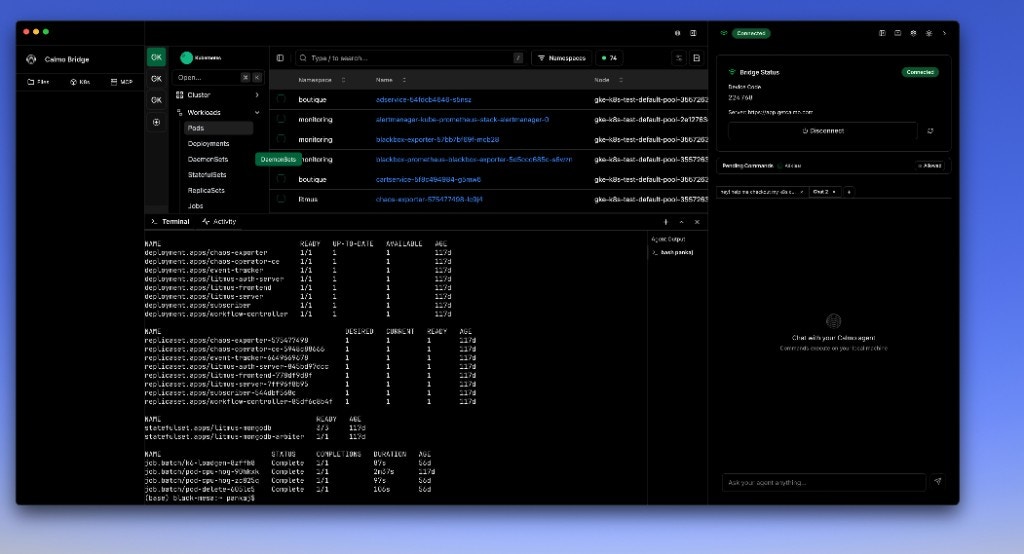
5
Continue Conversation
Calmo sees the output and continues the conversation in the chat panel. You can ask follow-up questions or request additional commands.
Visual Workflow
Integrated Terminal
Terminal Panel
The Terminal panel lives in the bottom section of the center area, below the file editor: Features:- Shell Prompt - Shows current working directory
- Real-Time Output - Command results stream as they happen
- Color Support - ANSI colors and formatting preserved
- Interactive - Supports prompts and user input
- Resizable - Drag the divider to adjust height
- Persistent - History persists across commands
Terminal vs. Activity Tabs
The bottom panel has two tabs:
Switch between them to see live execution or review past commands.
Command Approval Workflow
Approval Panel
The Command Approval panel appears in the top right of the interface: Layout:- Command - The exact command to be executed
- Risk Badge - Color-coded risk level
- Three Action Buttons - Deny, Always, Allow
- Queue Count - Number of pending commands (in header)
Approval Actions
- Deny
- Always
- Allow
DenyRejects the command. Calmo will be notified that you denied it.Use when:
- Command looks incorrect or dangerous
- You want Calmo to try a different approach
- The command would affect the wrong environment
Risk Levels
Commands are automatically classified by risk:- 🟢 Low Risk
- 🟡 Medium Risk
- 🔴 High Risk
Low Risk - Safe read operations that don’t modify stateExamples:Recommendation: Safe to use “Always” for frequently-used patterns
Command Execution
Basic Examples
Infrastructure Operations:Common Use Cases
Kubernetes Troubleshooting
A typical debugging workflow with the integrated terminal:1
Check Pod Status
You: “Check if there are any failing pods in staging”Terminal:
2
Describe Problem Pods
Calmo: “I see the api-server pod is in CrashLoopBackOff. Let me get more details.”Terminal:
3
View Logs
Calmo: “Let me check the container logs for errors.”Terminal:
4
Root Cause Found
Calmo: “The pod can’t connect to the database. The postgres service might be down or misconfigured.”
Development Environment Setup
Infrastructure as Code
Log Analysis
Long-Running Processes
The terminal supports processes that run continuously:Starting Background Processes
Managing Processes
While Running:- Output streams continuously to the terminal
- You can continue chatting with Calmo
- New commands can be approved and queued
- Ask Calmo: “Stop the port-forward process”
- Calmo will terminate the running process
- Or manually close the terminal tab
Long-running processes continue in the background even if you switch to the Activity tab. Switch back to Terminal to see live output.
Working Directory
Commands execute in the context of your configured workspaces:Workspace Context
If you’ve added/Users/pankaj/local_code/calmo-ci as a workspace:
Multiple Workspaces
With multiple workspaces, Calmo asks which one to use: You: “List the files in this project” Calmo: “Which workspace? You have:- calmo-demos
- calmo-ci
- calmo-gmail”
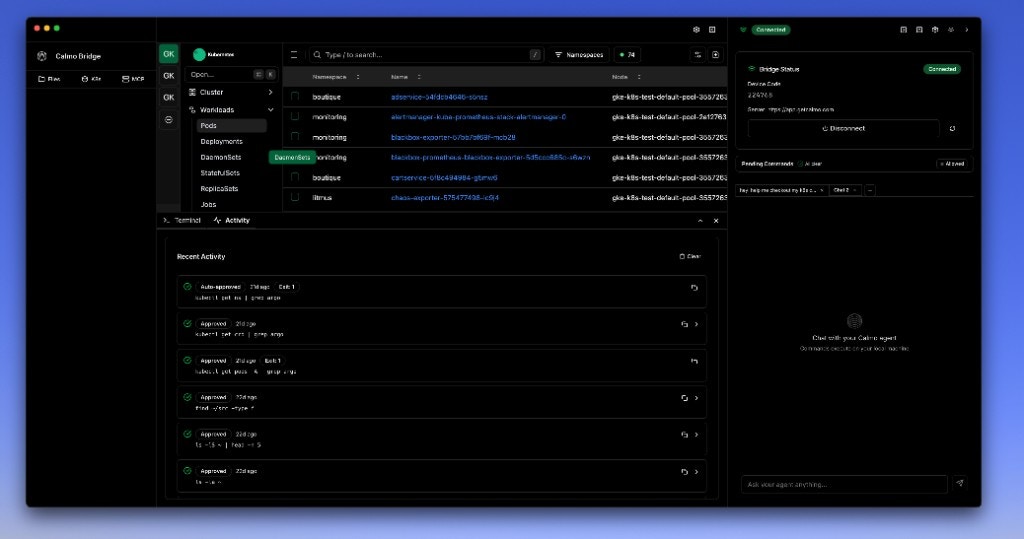
Activity Panel
Command History
The Activity tab shows all executed commands:- Status Icon:
- ✅ Auto-approved - Matched an always-allow pattern (shown with timestamp like “1d ago”, “2d ago”)
- ✅ Approved - Manually approved by you
- ❌ Denied - Rejected by you
- Timestamp - When the command ran (e.g., “1d ago”, “2d ago”, “Exit 1”)
- Command - The full command that was executed (e.g., “kubectl get ns | grep argo”)
- Exit Status - Shows “Exit 1” or “Exit 0” for command result
- Expand Arrow - Click to see full output and details
- Searchable - Find past commands by text
- Clickable - Click to expand and see full output
- Copyable - Click the copy icon to copy the command
- Filterable - Filter by status (approved, denied, auto-approved)
Managing History
Clear History:- Click Clear button to remove all history
- Useful for decluttering after long sessions
- Commands are logged for your audit trail
- Logs persist across bridge restarts
Environment & Shell
Shell Integration
Commands run in your default shell with full environment: macOS/Linux:- Uses your default shell (
bash,zsh,fish) - Sources shell profile (
.bashrc,.zshrc) - Environment variables available
- PATH and aliases work
- Shell functions available
- Uses PowerShell or cmd.exe (configurable)
- Environment variables available
- PATH settings honored
Environment Variables
Your shell environment is fully available:.bashrc/.zshrc are accessible.
Best Practices
1. Use Specific Commands
Target your commands to limit output and improve clarity:2. Preview Before Applying
For infrastructure changes, always preview first:3. Scope Operations
Limit scope to reduce risk and improve performance:4. Use Filters and Limits
Make output manageable:5. Set Up Auto-Approve Wisely
Safe to auto-approve:Troubleshooting
Command Not Found
If commands fail with “command not found”:-
Verify installation
-
Check PATH
-
Use full path
- Restart bridge to reload environment
Permission Denied
If commands fail with permission errors:- Commands run with your user permissions (not root)
- Some operations may need
sudo(use with caution) - Check file/directory permissions
- Verify you’re in the correct workspace
Output Not Showing
If command output doesn’t appear in the terminal:- Check Terminal tab - Ensure you’re on Terminal (not Activity)
- Scroll down - Output might be below viewport
- Wait - Some commands take time to produce output
- Check Activity tab - Command might have completed
Command Stuck
If a command seems stuck:- Check for approval - Ensure you clicked Allow
- Long-running - Some commands take time (e.g.,
kubectl apply) - Interactive prompt - Command might be waiting for input
- Ask Calmo to stop - “Cancel the current command”
Terminal Not Responding
If the terminal becomes unresponsive:- Refresh - Click the refresh icon
- Restart bridge - Quit and relaunch the application
- Check logs - Look for errors in Activity Log
For assistance with CLI tools and terminal usage, contact our support team at support@getcalmo.com.